Hello there,
Let’s take a moment to ponder. Where is Facebook spending all your money? What placements, device categories, or times of day work best for your campaigns? Which age group brings the highest conversion rate? If these questions don’t already form part of your regular reflections, it’s high time they did.
In the fast-paced world of digital marketing, we often find ourselves engrossed in crafting sophisticated strategies that we unintentionally overlook these significant yet somewhat elusive breakdowns. Today, in this 12th edition of Baweja Buzz, I want to guide you through the maze of Facebook Ads breakdowns

Why Breakdown Analysis Matters
Once upon a time, Facebook removed conversion metrics against these breakdowns, plunging many marketers into the dark ages. However, those equipped with data studio expertise and dynamic UTM utilization stayed afloat. Thankfully, Facebook reinstated conversion metrics for significant breakdowns, and all was right again in the marketing world.

With more than 30 breakdown categories to choose from, it’s easy to get overwhelmed. To simplify the process, I invariably focus on six key breakdowns:
1. Placement
2. Age
3. Gender
4. Time of Day
5. Device
6. Media Type
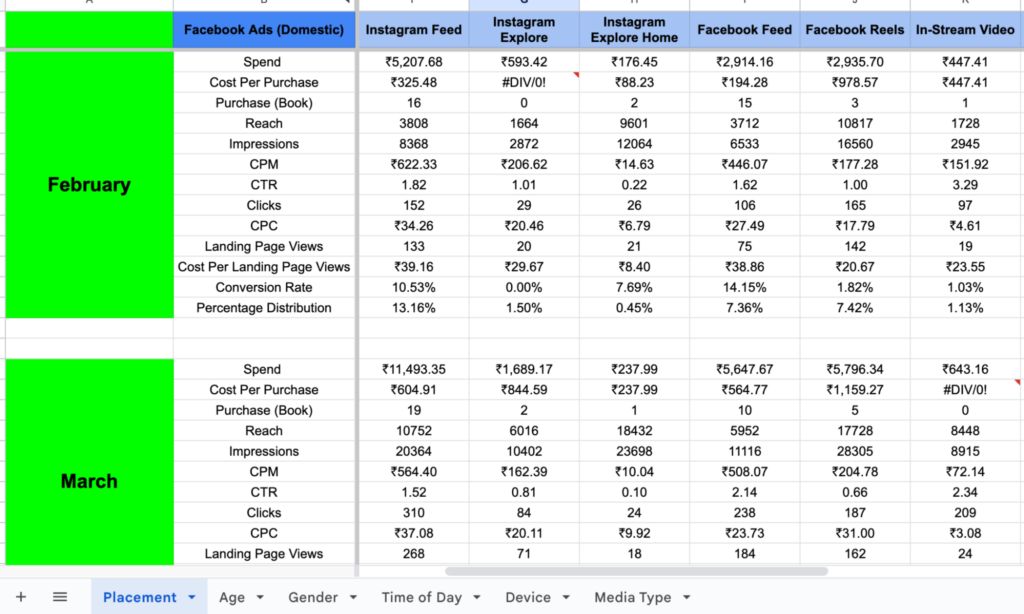
Here’s a screenshot of an example Excel sheet I use to give you an idea of how I go about this.
Why Placement Matters and How It Ties with the Bully Method
Of these six, I want to draw your attention to the significance of ‘placement.’ To understand its importance, we first need to recognize a fundamental truth: attention is a fickle creature, constantly flitting from one thing to another.
Recall when stories were the talk of the town? Everyone was fixated on them until short-form content reels came along, and the attention tide shifted. So, how do we keep track of these ever-evolving attention trends? Through spend distribution.
What does that mean? Well, Facebook will spend the most on the placement that currently garners the most attention. However, this can change from one month to the next, jumping from reels to stories, then to feed, and so on. Keeping an eye on spend distribution lets us know where the attention (and the money) is going.
Why is this critical?
1. Adaptability: Understanding spend distribution allows us to create ads tailored to the most profitable placement, ensuring our content aligns with user attention trends.
2. Learn from Nuances: Analyzing spend distribution can lead to intriguing insights. For instance, one of my accounts had only image ads, but the major spend was on Instagram reels, and the CPA was impressive. This indicated that Advantage+ creative is effective, suggesting potential success if replicated on other accounts.
3. ROI Analysis: The placement that gets the most spend might not necessarily be the most profitable. Spend distribution analysis could reveal that you’re unnecessarily pouring money into a low-performing placement. Adjusting or excluding that placement could save you a lot.
The implications are numerous, but I hope this gives you a glimpse into the possibilities. You can apply this analysis to other breakdown categories like time of day, gender, etc. However, it’s particularly crucial for placement breakdown due to its volatile nature.
Let’s look at some real-life data to better illustrate this point. Check out these two screenshots.
Here, I’ve noted the spend distribution for all the placements we were running. Let’s simplify by focusing on the top three: Instagram reels, Instagram stories, and Instagram Feed.
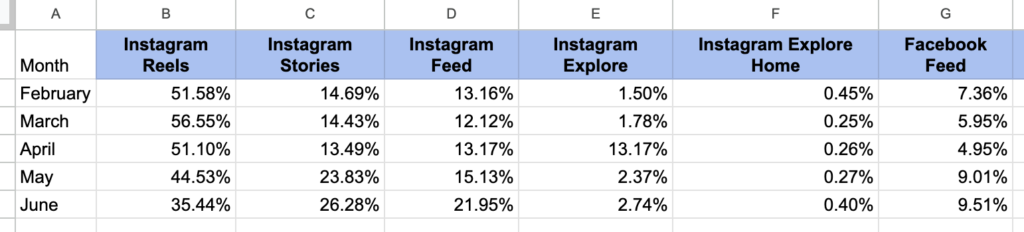
Now, look at this graph below, which shows the trend of spend from February to June.

In February, reels accounted for 51% of the spend. By June, it had fallen to 35.44%. Just imagine the strategic adjustments you could make with this kind of information!
As for the bully method and how you can use this information in conjunction with it, I believe we’ve already touched upon a substantial amount of information today. So, I’ll explain the bully method in detail in the next edition of Baweja Buzz. Stay tuned!
If you found this information valuable, drop a reply saying, “Bro, love you.” Yes, it’s a bit cheesy, but it’ll motivate me to keep sharing these insights, and it ensures I’m not just talking to a digital wall here.
Want to start using this simple template for your organization? Here’s the link to download it Click here . Make a copy and use it to your heart’s content.
Until next time, remember, the devil is in the details!
Best,
Sannidhya